
“He who lives by the crystal ball will eat shattered glass.”
-Hedge-fund titan, Ray Dalio
“The central principle of investment is to go contrary to the general opinion, on the grounds that if everyone agreed about its merit, the investment is invariably too dear and therefore unattractive.”
-JOHN MAYNARD KEYNES
A slick call on oil. Pretty much any EVA reader who has been tracking our outlook over the last few years realizes—as I painfully do—that we’ve been calling for a serious market shakeout since 2012. For sure, we’ve had a few corrections along the was—even a couple that were border-line scary—especially last August and at the start of this year. But nothing really serious has happened…or has it?
While the overall US stock market has been able to hover close to its highs, notwithstanding the aforementioned fleeting pull-backs, there have been some true bear markets in certain important sectors. Gold miners and biotech stocks are a couple of graphic cases in point. The former plunged an appalling 80% peak-to-trough, while the latter were tattooed nearly 40% from last summer through early February this year. Even after rousing rallies in 2016, they remain down 55% and 25% from their high points in 2011 and 2015, respectively.
Even more significant from a market standpoint was the mid-2014 to February, 2016, poleaxing in the oil complex. Crude itself crashed by 70% and, even though oil-related stocks held up better, the energy ETF (XLE) was essentially cut in half. The oil carnage became so severe that at one point it was spilling over into the stock market itself, with every downtick in crude pushing stocks lower at the outset of this year.
Consequently, what we’ve seen in recent years are a series of rolling bear markets (small- and mid-cap stocks also fell enough over the past twelve months to qualify for bear status, as well). This has allowed the purging of speculative excesses without bringing down the S&P 500. Perhaps, that’s what we will continue to see with the market in general zigging and zagging without making much headway. If so, it will be essential to allocate funds to those areas that are severely over-sold and out-of-favor in order to produce superior returns in a world where central banks have left very little juice to be squeezed out of markets. Which brings me to this month’s Guest EVA, courtesy of our friends at Ned Davis Research (NDR).
Back on August 8th, I read an NDR piece titled “Is the Oil Correction Over” by Warren Pies. At the time, it hit me as one of the most important research pieces I’d read over the summer. Warren kindly gave me his permission to share this with our EVA readership and the first thing I would like you to notice is that he starts out by focusing on how bearish money managers were on oil in early August. This helps skew the odds in favor of the contrarian so that any positive news can have an outsized impact (which is exactly what happened).
Warren also touches on the power of narratives or stories, similar to the key point of the August 5th, Webinar EVA about memes, themes, and dreams. As he notes, there is almost always a degree of validity to these beliefs but often the concept becomes distorted and/or exaggerated. He points out that has been the case with the bear stance concerning how high gasoline inventories are currently. His chart at the bottom of page 7 conveys the true story in a way that the still-populous bear camp will have a hard time refuting.
To his credit, Warren wrote this just as oil was ready to rocket from its mini-bear market low of a bit under $40 to back up to $50, before experiencing a mild (so far) retracement. In other words, he made an excellent bullish call at almost the perfect time. Importantly, he sees more upside ahead for oil.
If so, energy stocks, including the pipelines, should have additional upside. Combined with still lofty yields, this is a combination that most industries/sectors will be hard-pressed to match.

David Hay
Chief Investment Officer
To contact Dave, email:
dhay@evergreengavekal.com
By Warren Pies, ERP Energy Strategist
John Lyon, CFA U.S. Market Analyst
“What is the highest pleasure? To hear a good story.”
-VIKRAM CHANDRA, Red Earth and Pouring Rain
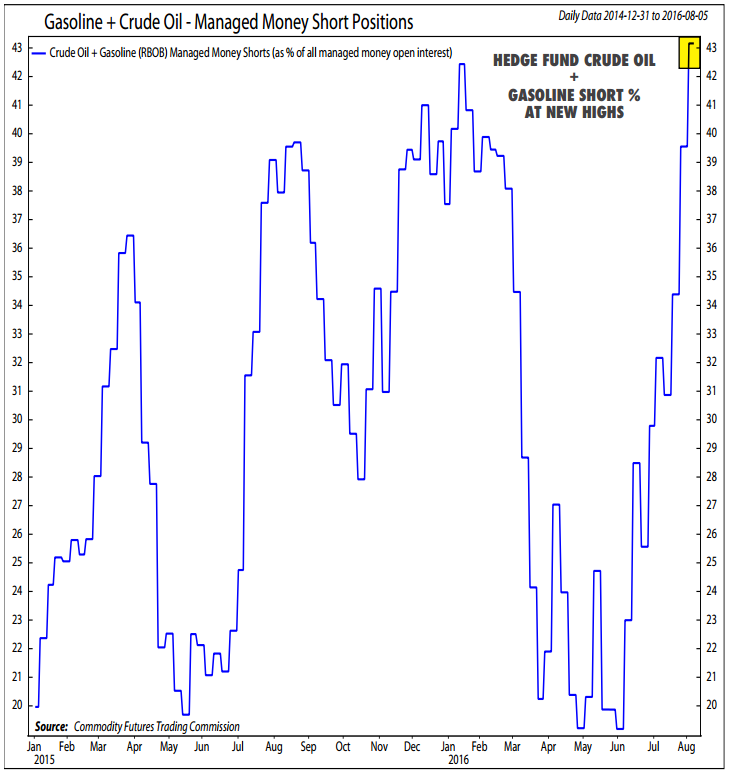
To avoid burying the lead, we will answer the question posed in the title of this report up front: Is the oil correction over? Yes. We believe so. Two months ago, we warned that oil was likely to undergo a “meaningful selloff (10-20%).” At the time, futures positioning reflected excessive optimism. The U.S. Dollar was near the bottom of its 18-month trading range. And, the rig count was, finally, beginning to rebound. Since then, oil prices have declined by 22% (to last week’s lows) and sentiment has reversed 180 degrees. Contracts held short by hedge funds and CTAs – a group labeled by the CFTC as “Managed Money” – have quadrupled. As a result, for the first time since late January, short positions make up more than 40% of Managed Money open interest (chart to th right). Previously, we urged bulls to wait until this number hit 35% before adding exposure. At +40%, the stage is now set for another short-fueled oil rally.
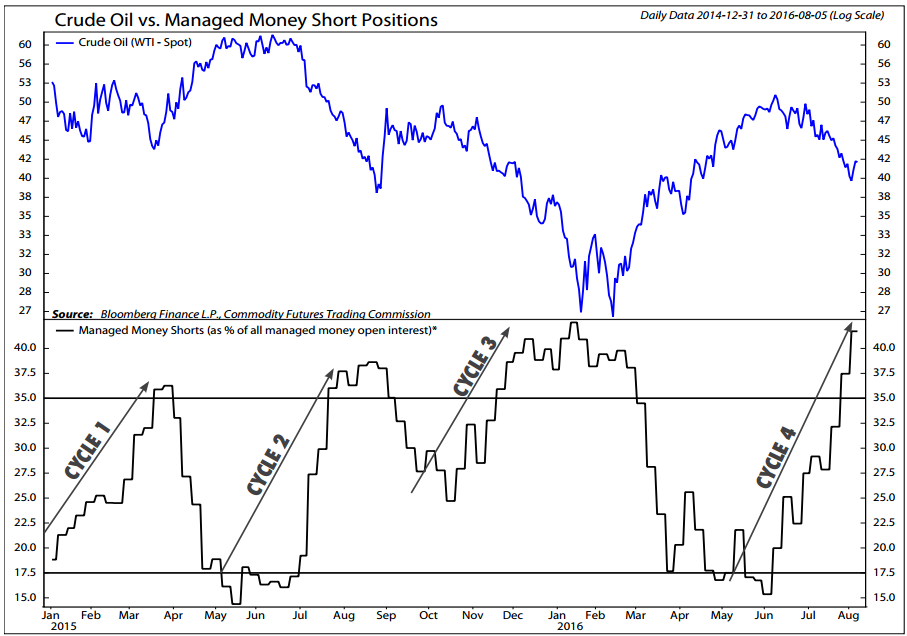
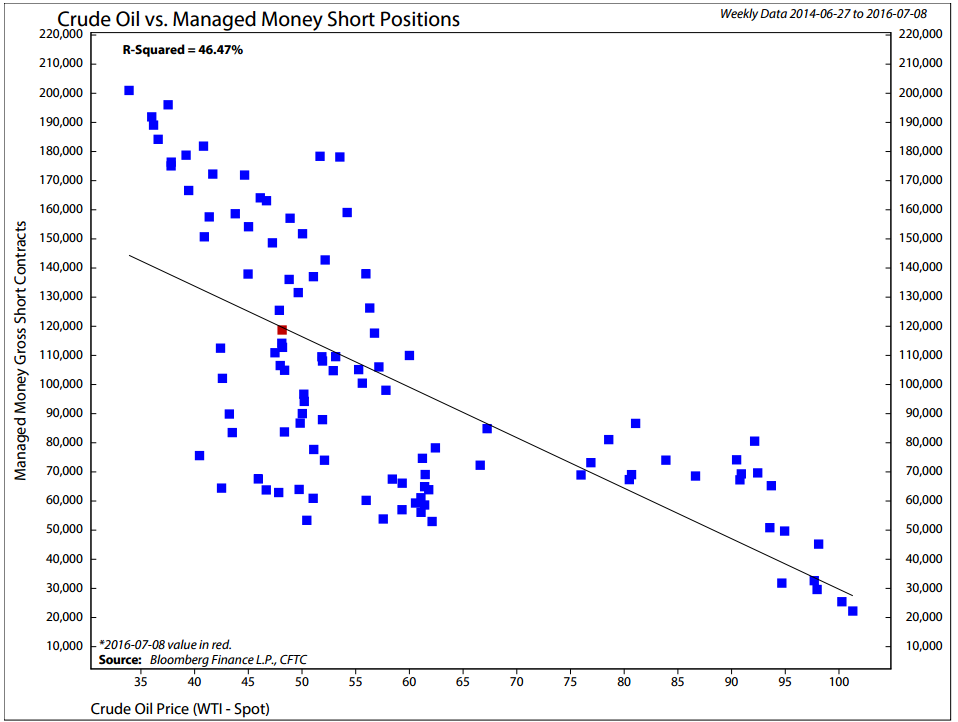
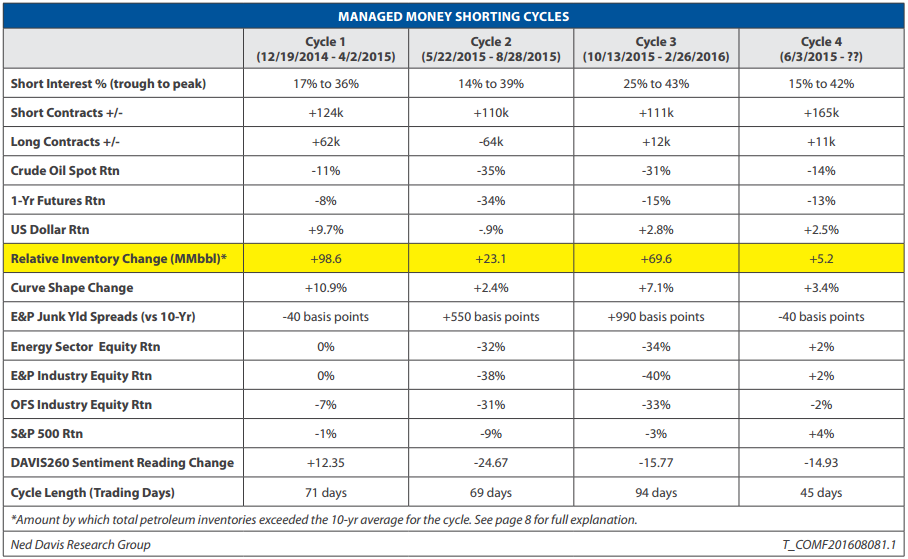
In the two years since oil began its descent, Managed Money short positioning has done an excellent job of quantifying the ebb and flow between excessive pessimism (35-40%) and optimism (15-20%). The scatter plot on the below shows the strong relationship between oil prices (x-axis) and the total number of NYMEX futures contracts held short by hedge funds and CTAs. Going back to late 2014, there have been four distinct hedge fund short cycles (including the current). These four cycles are apparent in the chart above. At the lows in March 2015, August 2015, and February 2016, Managed Money short positions exceeded 35% of total open interest. In each case, as shorts covered, oil prices rallied. In the table following this chart, we display key stats that have shaped each short cycle. We reference these four cycles throughout this report.
Typically, sentiment extremes are fueled by a “good story”, or narrative. A story gives investors cover to ignore fundamentals, and allow emotions to trump data. In order to be compelling, a good narrative must originate in truth. It must be convincing, and accurate, enough to convert otherwise rational investors into fearful (or greedy) lemmings. The current extreme in crude oil short positioning is no different.
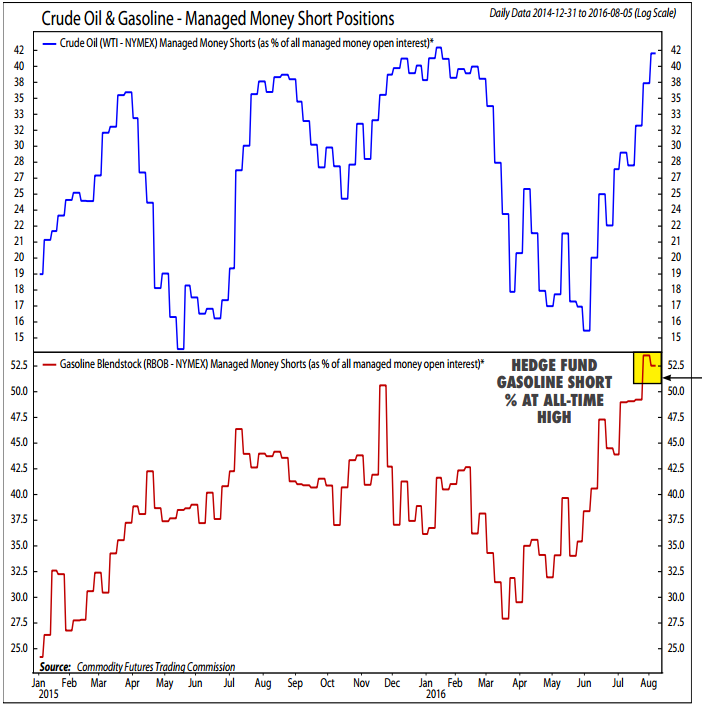
This time around the story prompting hedge fund managers to short crude oil futures is a feared refined product glut. When we look at gasoline (RBOB) futures positioning, this narrative becomes clear. In the chart below, we plot the same measure of Managed Money short positioning (% of total Managed Money open interest held short) for crude oil (top clip, blue line) and gasoline (bottom clip, red line). At the end of July, gasoline short positions made up roughly 54% of total Managed Money open interest – an all-time high.
The chart below shows just how bearish hedge fund sentiment is towards the entire petroleum complex – both crude oil and refined products (e.g. gasoline). It combines crude oil and gasoline short contracts and compares them to total crude oil and gasoline managed money open interest. The blue line plots the percentage of total crude oil and gasoline contracts held short by the Managed Money group. At more than 43% short, combined – gasoline plus crude oil – hedge fund positioning has now reached a new bearish extreme. We believe the high levels of both crude oil and gasoline short positions reflects a thesis among hedge funds that the growing refined product glut (e.g. gasoline, diesel, jet fuel, etc.) will bleed over into crude oil prices.
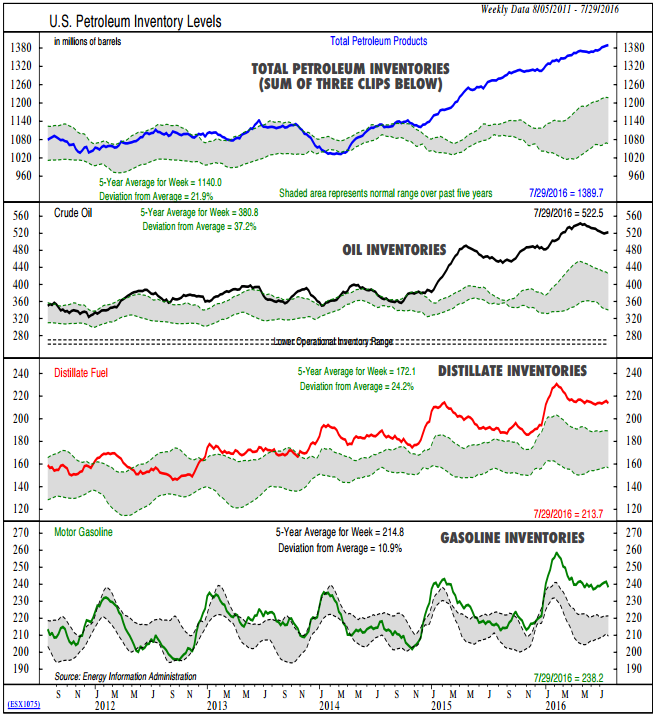
As we said, a convincing narrative must be grounded in truth. And, the refined product glut is a reality. In the chart to the left, we plot crude oil inventories (second clip), and refined product inventories - distillate fuels (third clip) and gasoline (bottom clip). Across the petroleum complex – crude oil, gasoline, distillates or total petroleum – inventories are, basically, at alltime highs.
We have monitored the growing refined product glut since March (see here and here). In short, bloated refined product inventories pressure refined product prices, and ultimately, refining margins. If refining margins sink too much, then refiners reduce runs. Lower refinery runs amount to lower crude oil demand. In the past two months, refining margins have been severely pressured, prompting new concerns that refiners would cut back crude oil consumption.
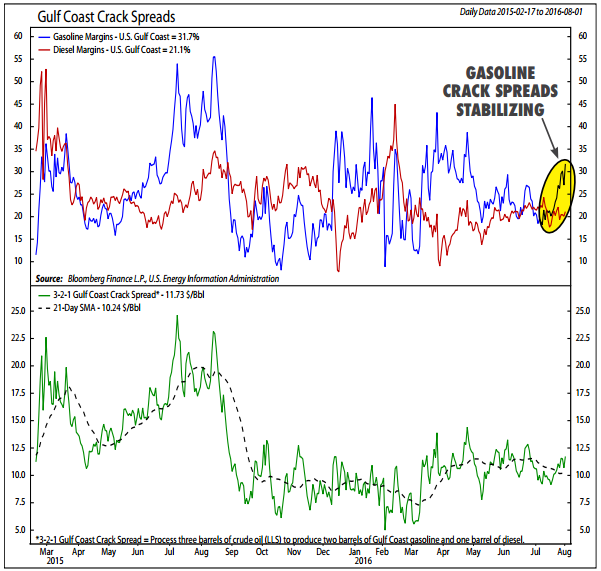
However, a recent bounce in gasoline crack spreads (U.S. Petroleum Inventory Levels chart, blue line) along with decent gasoline inventory reports (chart above, bottom clip) argue against extreme pessimism. Also, in recent weeks most independent refiners have reported second quarter earnings. While a few geographically disadvantaged units (e.g. Northeast U.S. and Northwest Europe) will cut runs, most major refineries plan to continue running at record utilization rates. At current margin levels, we believe refiners will continue to process near-record crude, supporting oil prices.
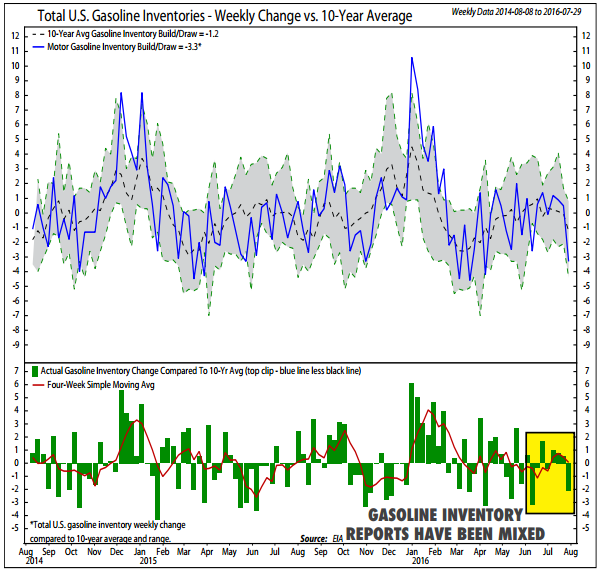
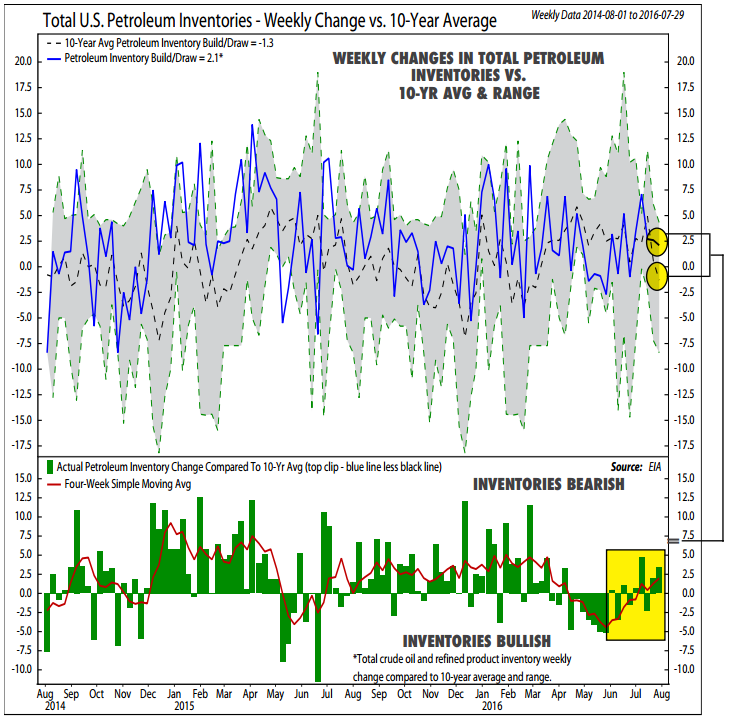
While hedge funds have focused on the doomsday refined product “story,” the actual data during this short cycle has been benign. Below, we shift gears from the story to the data. Longtime readers will recognize our total petroleum inventory indicator (chart below). It measures the seasonally adjusted changes in total petroleum inventories, which includes both crude oil and refined products (top clip). It does this by comparing each week’s total petroleum inventory change (top clip, blue line) to the 10-year average (top clip, black dashed line). The difference between the actual inventory change and the expected shows up as green bars in the bottom clip. When these bars are above zero, it indicates that total petroleum inventory changes were above the 10-year average for the week. Finally, we smooth this data by four weeks (bottom clip, red line) to identify a trend. In the highlighted box, we have zeroed in on the data points that have occurred during the current short cycle. During the period, inventory reports have indeed been slightly worse than average. However, compared to the three previous short cycles, this cycle has been relatively positive. On the next couple pages, we compare inventory data across the four hedge fund short cycles.
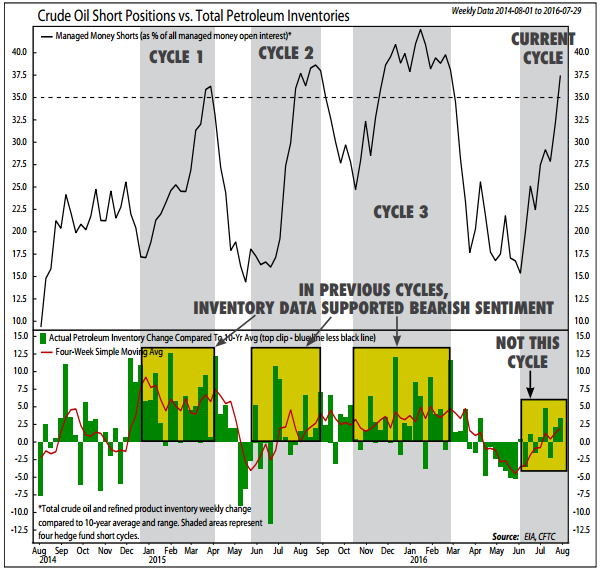
In the chart below, we modify our petroleum inventory chart by swapping in crude oil Managed Money short positioning (top clip) and labeling each of the four short cycles (shaded areas). The bottom clip is the same total petroleum indicator (current vs. 10-year) that we highlighted on the previous page. In the three previous short cycles, total petroleum inventories deteriorated much more than they have during this fourth cycle.
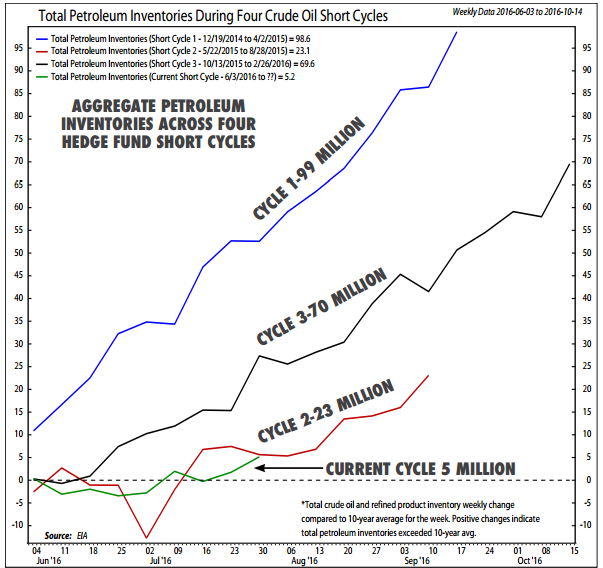
The chart to the left makes comparing inventories across the four short cycles easier. Here, we aggregate the green bars from the chart above – which is the amount that each week’s total petroleum inventories deviated from the 10-year average for that week – for each of the four hedge fund short cycles. During this cycle, petroleum inventories have only exceeded the 10-year average by 5 million barrels. In the three other short cycles, petroleum inventories exceeded the 10-year average by 99 million (early 2015), 23 million (spring/summer 2015), and 51 million barrels (late 2014/early 2015). Bottom Line: The actual inventory data during this crude oil short cycle does not match the extreme pessimism reflected by hedge fund short positions.
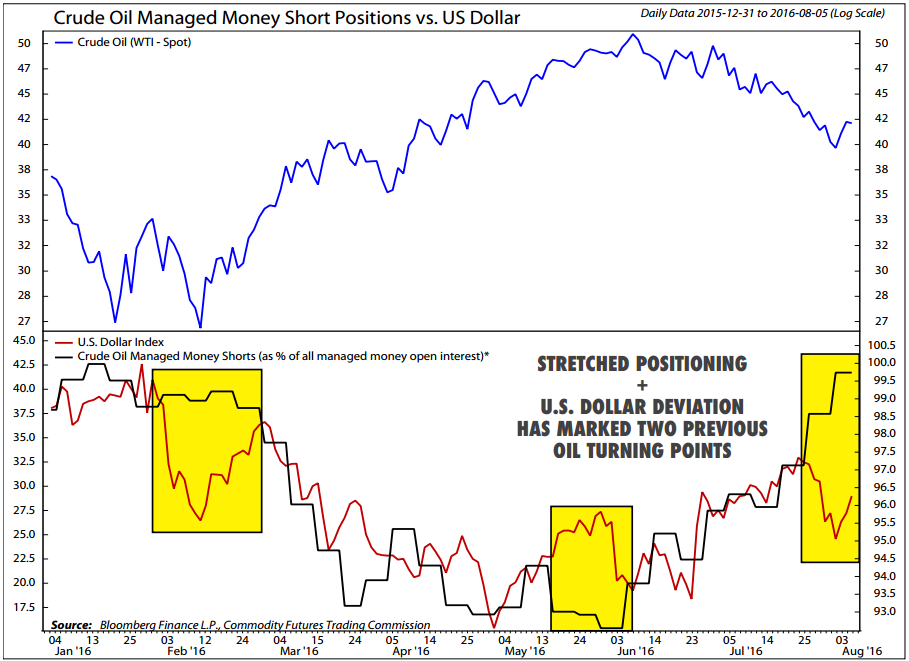
Another OPEC freeze rumor, a Dollar selloff (see chart below), or a stronger than expected inventory report are all candidates to spark hedge fund short covering and a new oil rally. In the final analysis, the catalyst is less important than the underlying market structure. For years, Ned has warned to be “wary of the crowd at extremes.” Current hedge fund positioning is at a bearish extreme. Clients should be wary of joining them. Bottom Line: In early June we warned that optimistic hedge fund positioning made a “meaningful selloff (10-20%) more likely.” We concluded our report by saying that: “If weakness materializes, we would be buyers.” After a 22% selloff and a spike in short interest, we recommend clients add oil exposure.
INVESTMENT IMPLICATIONS
-Hedge fund managed money short positions have grown from 15% in early June to more than 40%.
-Betting on a refined product disaster, hedge funds have also increased gasoline short positioning to an all-time high.
-Summer inventory data does not support the extreme hedge fund pessimism and is not in line with previous short cycles.
-Since early 2015, we have recommended investors own integrated oil companies. We now recommend clients rotate their
oil equity exposure out of these large integrated companies and into high quality MLPs and upstream operators.
-Despite our early 2016 optimism, Oil Refiners have badly lagged the Energy Sector.
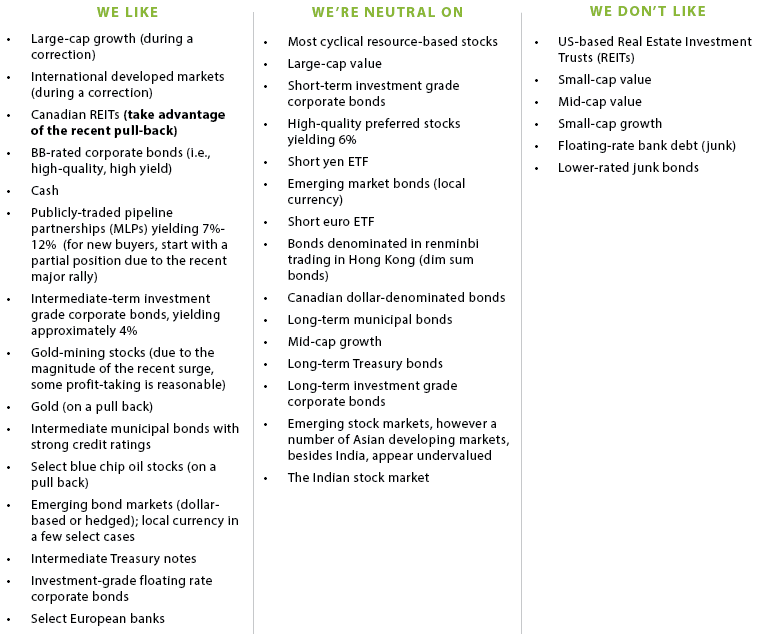
OUR CURRENT LIKES AND DISLIKES
Changes are bolded below.
DISCLOSURE: This material has been prepared or is distributed solely for informational purposes only and is not a solicitation or an offer to buy any security or instrument or to participate in any trading strategy. Any opinions, recommendations, and assumptions included in this presentation are based upon current market conditions, reflect our judgment as of the date of this presentation, and are subject to change. Past performance is no guarantee of future results. All investments involve risk including the loss of principal. All material presented is compiled from sources believed to be reliable, but accuracy cannot be guaranteed and Evergreen makes no representation as to its accuracy or completeness.